
GTM: Is One-Size-Fits-All Holding Back Your GTM?
Use this diagnostic tool to assess your current motions and uncover the right-fit model for every customer segment.


As sub-scale SaaS businesses grow, two things start to happen, whether by design or organically:
More customers sign up.
Those customers vary in size and type, with some proving to be a much better fit than others. (I cover more on iterating on your ICP [here].)
For "type," this might mean customers from different industries or using different tech stacks. But in this post, we’re focusing on customer size.
In a prior post, I outlined the key differences in customer expectations and GTM execution when comparing large-ACV vs. small-ACV customers. As growth accelerates, companies often hit an inflection point, one where teams feel a tug-of-war between small and large customers. This is usually the moment to move from a “one-size-fits-all” (OSFA) strategy to a segmented GTM approach across marketing, sales, customer success, support, and product.
Marketing may shift toward enterprise messaging, which can alienate smaller customers. Sales teams get stretched, juggling large strategic deals and quicker lower ACV opportunities. Customer Success struggles to support both complex enterprise setups and simple implementations. Meanwhile, Product must decide between building broad, self-serve features or investing in advanced integrations for larger customers. These patterns highlight the need for a more segmented approach as the business grows.
This post introduces a framework and template to help you accelerate customer segmentation. A downloadable version is linked here.
Step 1: Understand your prospects and customers
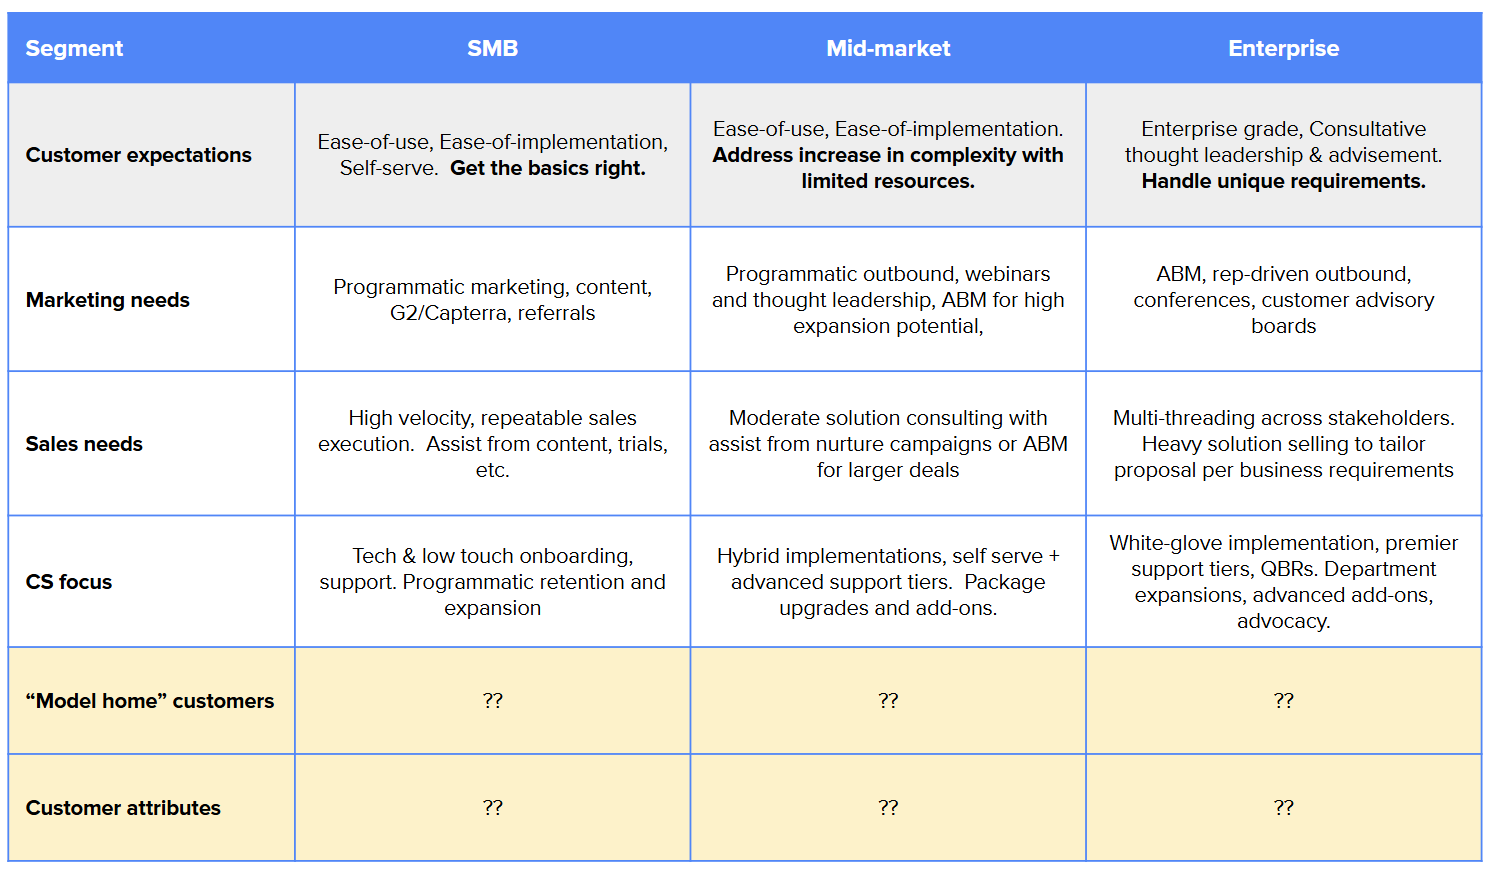
Start by documenting your hypothesis about the differing expectations and needs of larger vs. smaller customers across functions (Marketing, Sales, CS, etc.) Don’t rely solely on instinct; it's often biased toward the biggest, loudest or earliest customers.
Invite cross-functional input, even from Product and Engineering. Their insights can illuminate recurring escalations or prioritization challenges.
Then, identify “model home” customers…clear, real-world examples that reflect each customer segment. These help your team visualize and align around segment characteristics.
While this approach may be slower than directing segmentation based on instinct, it opens up an objective way to gain rounded perspective from team members and validate those assumptions with customers. Each business has its unique attributes, but having seen this journey across multiple pre-revenue to $30M+ ARR businesses, the below represents common patterns as a starting point.
Step 2: Analyze your revenue distribution
Next, take a look at your data. Revenue will be the biggest driver of behavior, prioritization, and in many cases a proxy for customer size (more users, more volume of data, more budget, etc.).
Export customer-level ARR from your billing or subscription platform.
Sort from highest to lowest ARR.
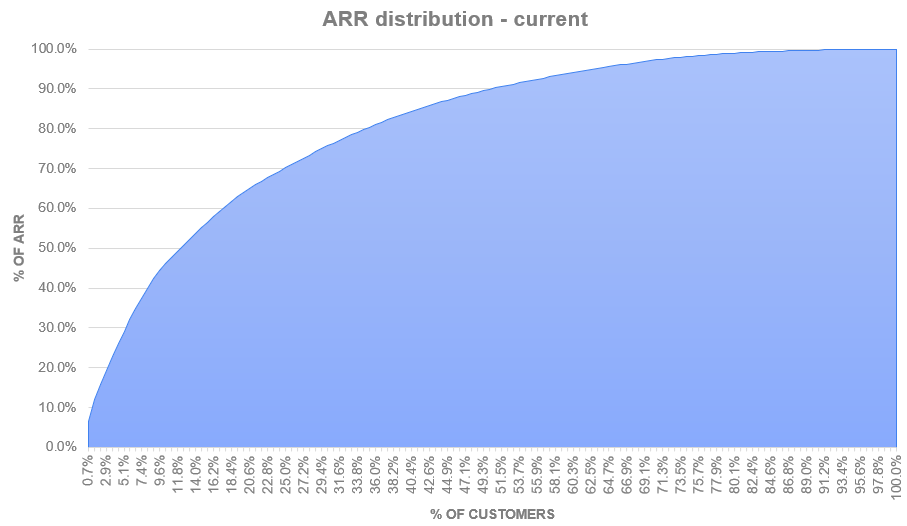
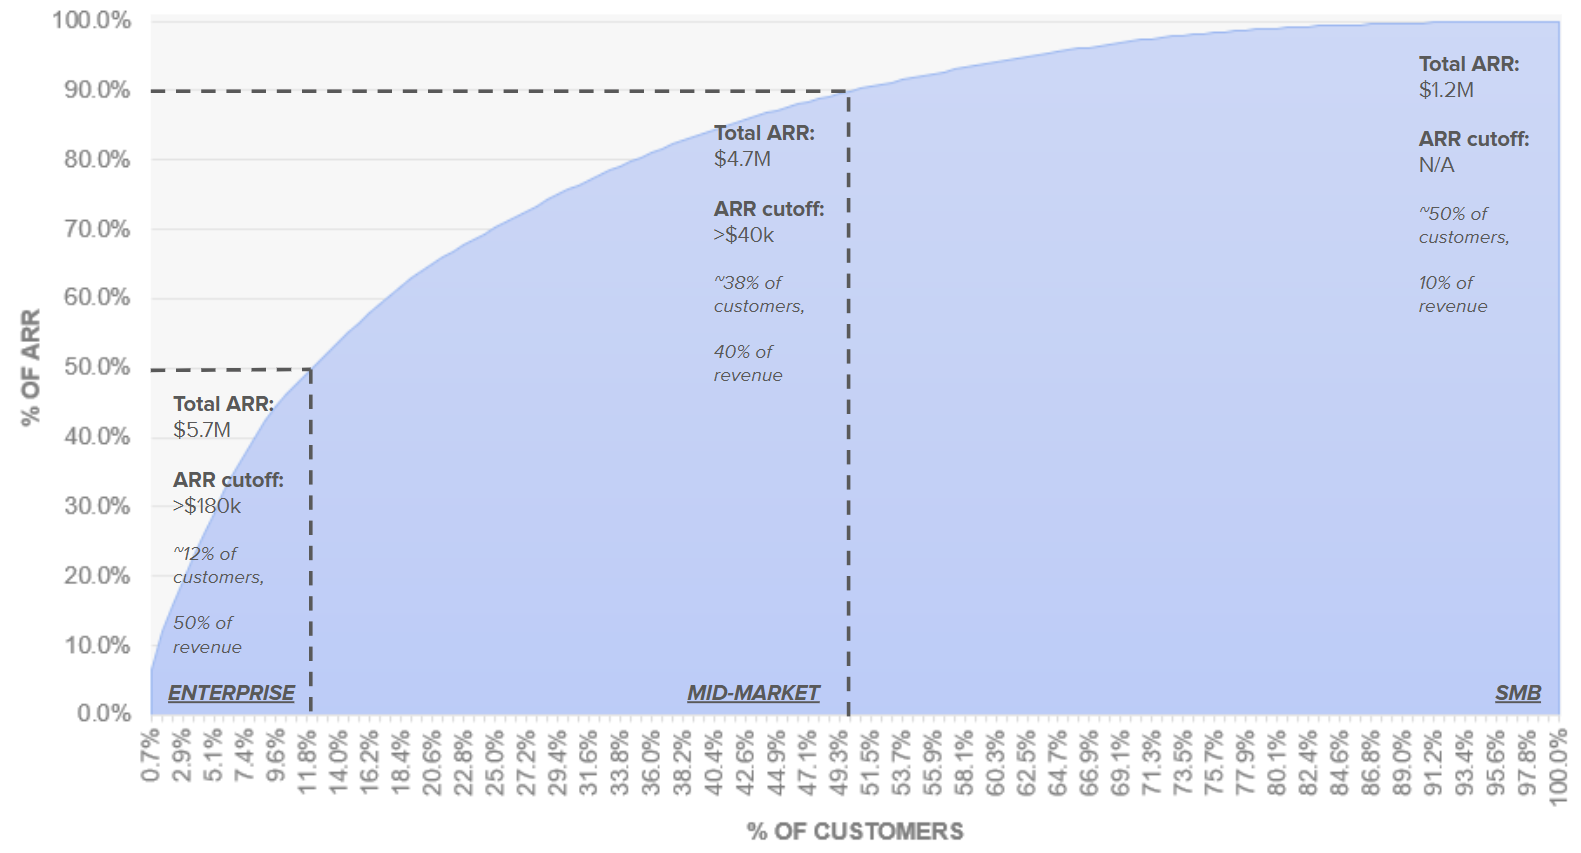
Plot cumulative % of ARR vs. cumulative % of customers.
You’ll likely see a steep curve where a small % of customers make up a large % of revenue. In this example, ~12% of customers account for 50% of revenue.
(If it were a straight diagonal, every customer would contribute the same ARR.)
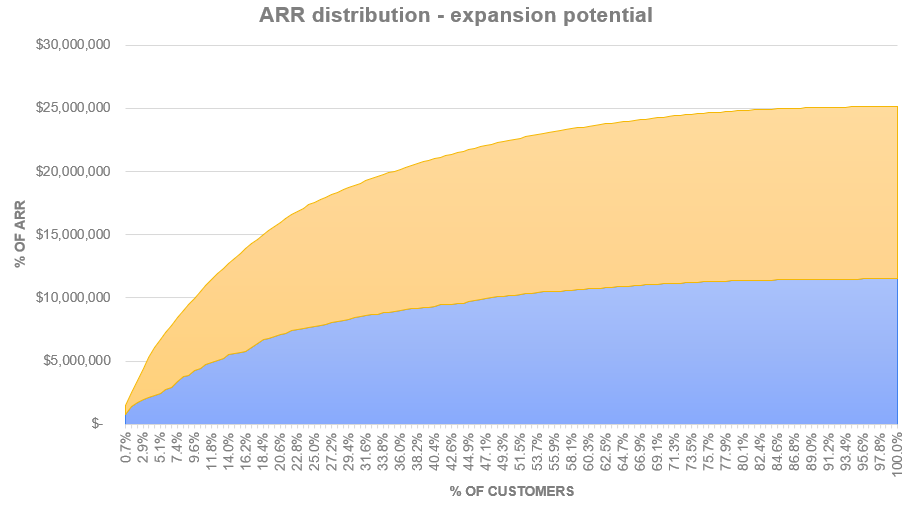
Add expansion potential per customer. Use your pricing index (e.g. users, payment volume) to estimate upside. Even directional estimates are helpful. In the example below, the expansion potential is represented in yellow, meaning existing penetration in blue is at 46%.
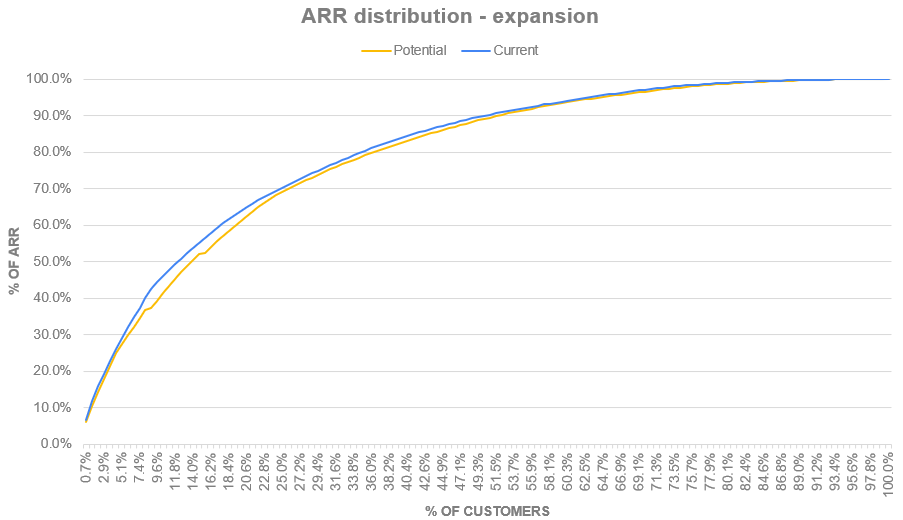
Compare current ARR distribution to potential future state. If the shape doesn’t shift dramatically, you can feel confident in using this analysis to inform segmentation. In this example, the future state distribution isn’t too far off of current (~15% of customers represent 50% of revenue rather than ~12%).
Step 3: Define GTM Segment Cutoffs
Now the rubber meets the road. Use this analysis to design your GTM structure, org alignment, and systems for visibility and execution.
Start with data-informed, but ultimately arbitrary cutoffs. Example:
Enterprise: >$180K ARR per account
(12% of customers, 50% of revenue)Mid-market: $40K–$180K ARR
(38% of customers, 40% of revenue)SMB: <$40K ARR
(50% of customers, 10% of revenue)
But here’s where the art vs. science comes in.
In this depicted example:
The company has a small number of very large customers (12% = 50% of ARR).
Selling $100K vs. $180K ACV required similar effort.
20% of customers were < $10K ACV, with high CAC and poor LTV.
The company wanted to double down on mid-market ($25K–$100K ACV) where the product had real differentiation.
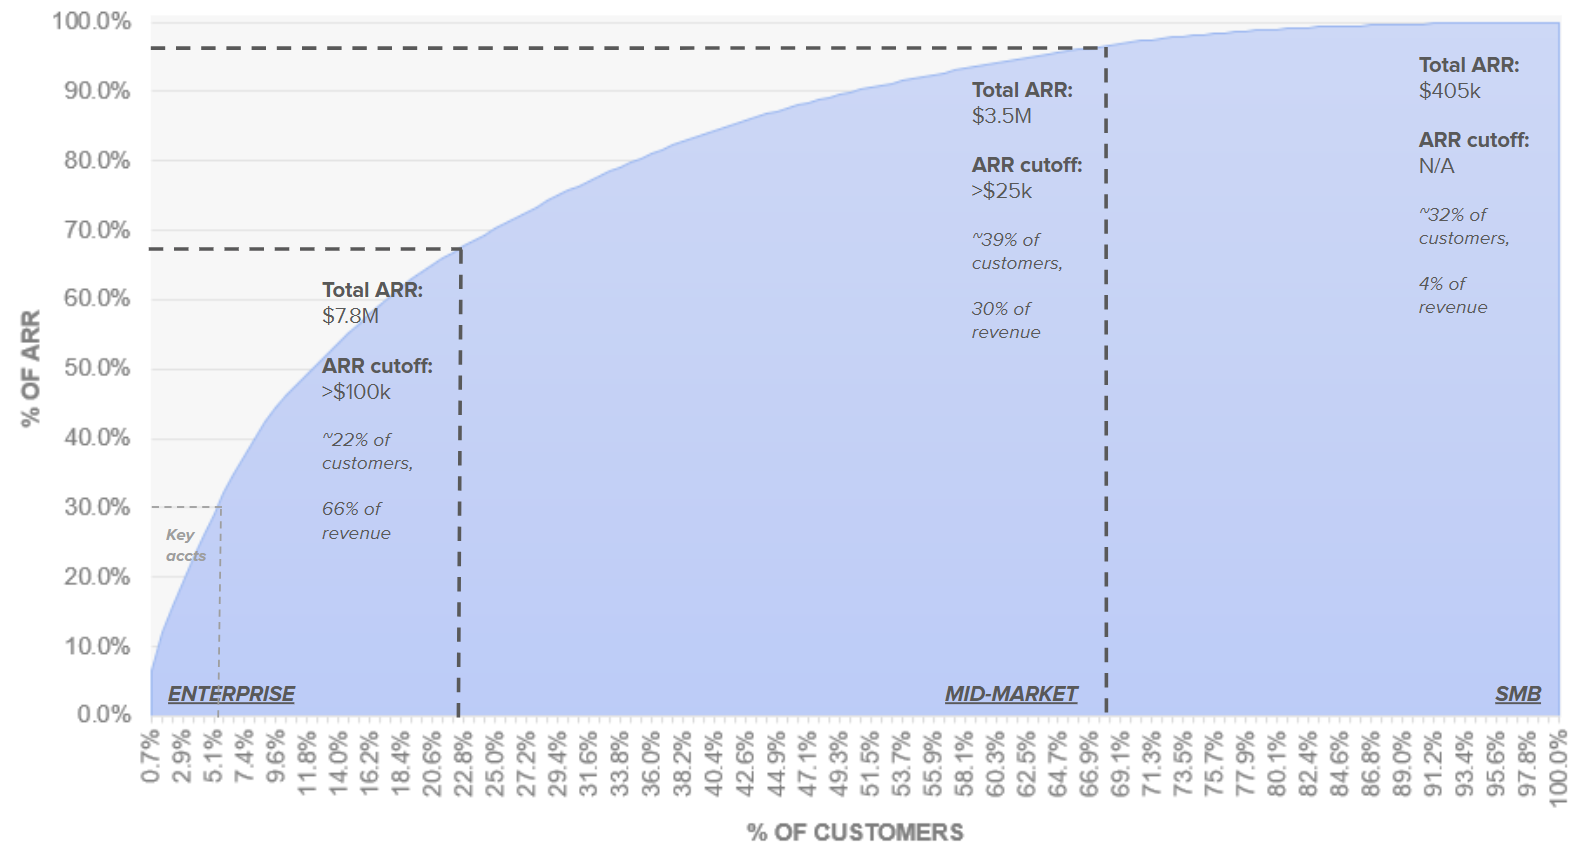
So the revised segmentation looked like this:
Enterprise: >$100K ARR
(22% of customers, 65% of revenue).
Includes a carve-out of 10 key accounts with executive sponsors and expansion focus.Mid-market: $25K–$100K ARR
(39% of customers, 30% of revenue).
Primary focus for new acquisition—scalable product, repeatable sales.SMB: <$25K ARR
(32% of customers, 4% of revenue).
Tech-touch servicing. Pricing minimums considered to ensure profitable growth.
Step 4: Operationalize segmentation
There’s too much detail here to cover in one post. But once your segmentation is clear, you'll want to align:
GTM motion by segment
Team structure (Sales, CS, AMs, etc.)
Process playbooks
Product prioritization
Data instrumentation
Comp plans and incentives
Following the example briefly that we’ve walked through together above, some quick decisions that we can infer include:
SMB: Apply price minimums for the smallest 20% of customers. Design a tech-touch motion for SMB to ensure easy acquisition, onboarding, and self-serve support. This may mean an investment in product usage analytics, support knowledge base, tighter SQL criteria to weed out prospects with low budgets and potentially staffing a more junior CSM that covers a larger amount of accounts.
Mid-market: Focus on building out repeatable sales motion, pipeline generation and implementation methodology. This is where the most anticipated new logo volume will come from. Ensure the CSM and support team has clear capacity benchmarks and incentives in place to be able to scale more accounts as growth actualizes.
Enterprise: Ensure seasoned account managers focused on the top 10 accounts to take care of the concentration of revenue and execute on expansion opportunities. Work with product to curate product advisory boards to deepen relationships with customers but to also get proactive feedback (rather than being reactive to perceived custom requirements from large customers).
The real value comes when every function (marketing, sales, CS, product) can see the same picture and prioritize accordingly.
If you’re at the inflection point where tension between customer segments is surfacing, this framework is a launchpad to move from reactive to intentional. Use the template, gather cross-functional input, and align your org around the customers who drive real, scalable value.